Your Online conversion rate shows the percentage of shop visits that result in an online order. Tracking it over time can help you understand how effectively your shop is turning visitors into customers.
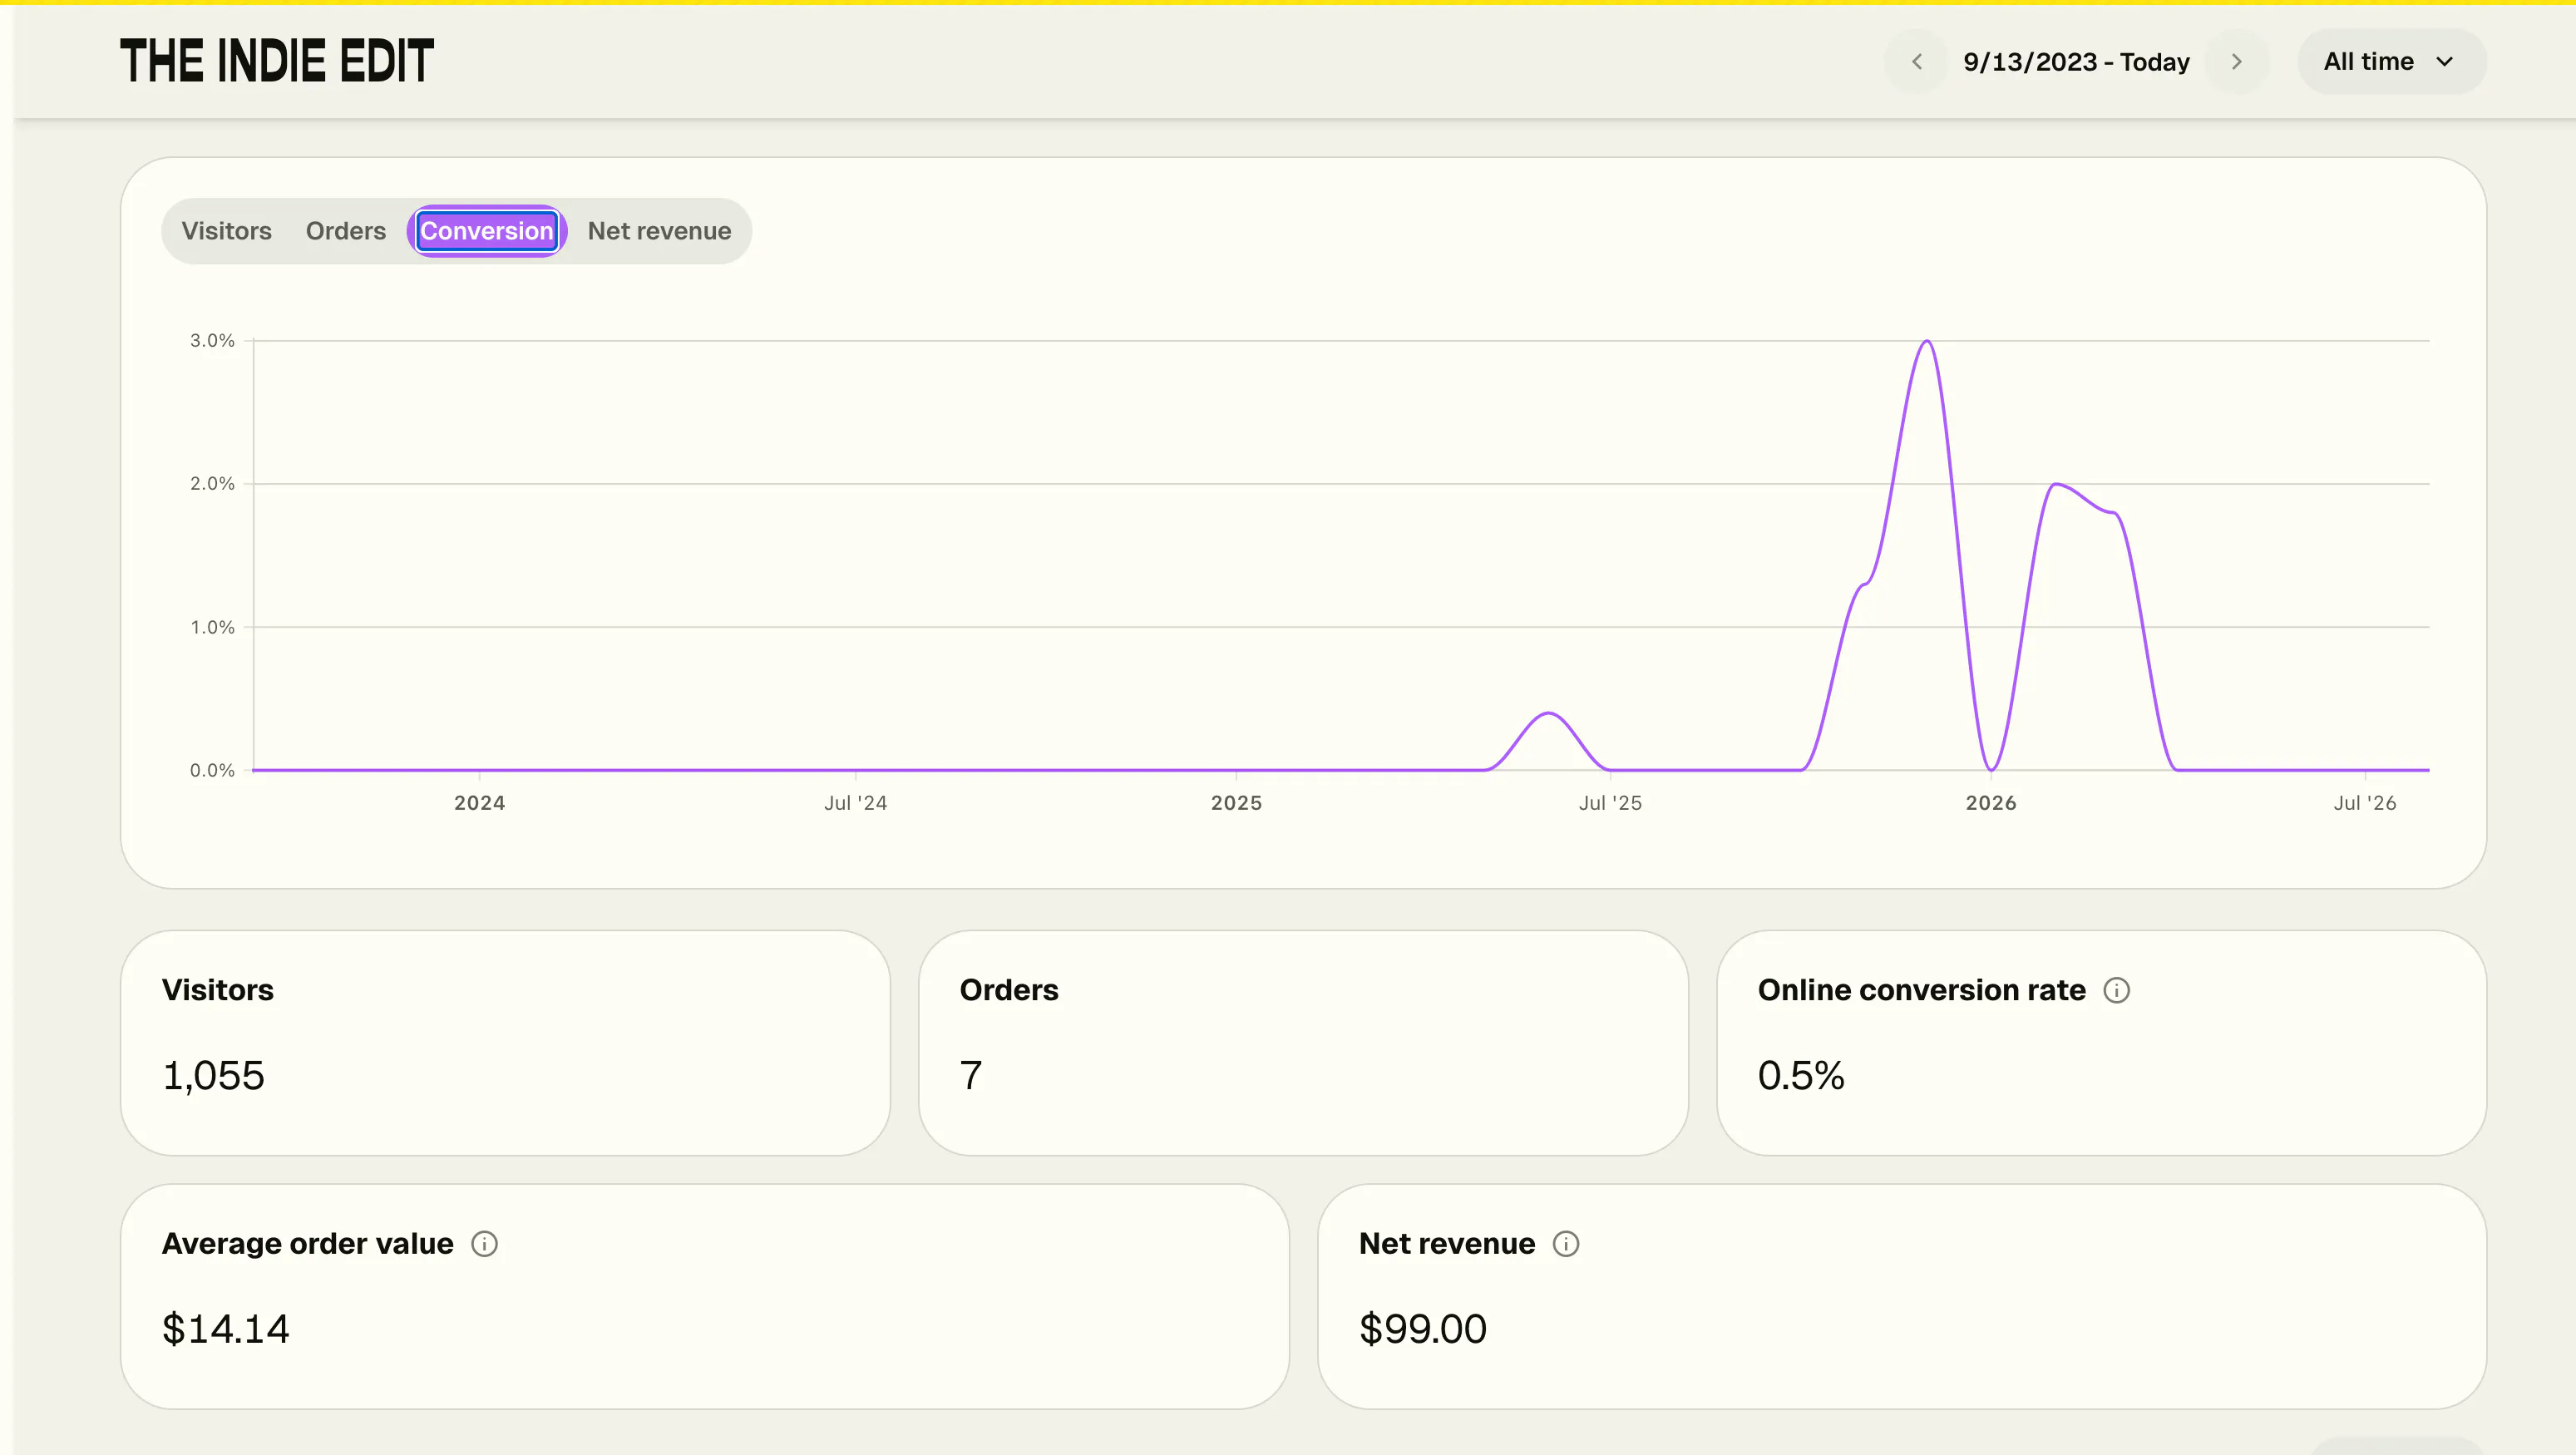
Understand your online conversion rate
Online conversion rate is based specifically on shop visits and online orders.
In-person and subscription orders are excluded because they don't come from a visit to your online shop. This keeps your conversion rate focused on how well your storefront is turning visitors into customers.
For example, if you make sales in person or receive subscription orders during the same period, those orders won't be used to calculate your Online conversion rate.
There's no single conversion rate every shop should aim for. What you sell, your pricing, where your traffic comes from, promotions, and seasonality can all affect it. The most useful benchmark is usually your own shop's performance over time.
Track conversion over time
Select Conversion above the graph on your Dashboard to see how your Online conversion rate has changed throughout the selected date range.
Use the date controls at the top of the Dashboard to look at a specific period, from recent activity to longer-term trends.
Your Dashboard also compares your selected date range with the previous matching period by default. This makes it easier to see whether your conversion rate is moving up or down.
For example, if you select the last 30 days, your current performance is compared with the 30 days immediately before it.
The graph displays both periods so you can see where performance changed over time.
Understand changes in your conversion rate
Your conversion rate is most useful when viewed alongside your traffic and sales activity.
For example:
- If shop visits increase but online orders don't, your conversion rate may decrease.
- If visits stay relatively steady while online orders increase, your conversion rate will improve.
- If both visits and conversion increase, you're attracting more traffic while also turning more of those visits into purchases.
Keep in mind that only online orders connected to shop visits are used for conversion. In-person and subscription orders won't affect this metric, even though they're still part of your overall sales activity.
Look at your other Dashboard stats
Your Dashboard includes several metrics that can help add context to your conversion rate:
- Visitors shows traffic to your shop.
- Orders shows your orders for the selected period.
- Online conversion rate measures how often shop visits result in online orders. In-person and subscription orders are excluded.
- Average order value is your Net revenue divided by orders for the selected period. Only orders in your shop's current currency are included.
- Net revenue is your gross sales minus order discounts and refunds, excluding tax and shipping.
Looking at these stats together can give you a better understanding of what's driving changes in your shop.
For example, a promotion might bring significantly more visitors to your shop without increasing conversion. Another campaign might bring less traffic but result in a higher percentage of visitors placing an order.
Use trends to learn what's working
Try comparing your conversion rate before and after things like:
- Launching a new product
- Running a promotion or discount
- Sending an email campaign
- Promoting your shop on social media
- Updating product photos or descriptions
- Making changes to your shop design
Seasonality can affect your results too, so focus on trends rather than any single day's conversion rate.
Comparing periods can help you see whether changes are temporary or part of a larger trend.
View your conversion rate
- Log in at app.bigcartel.com.
- Go to Dashboard.
- Select the date range you want to review.
- Select Conversion above the graph.
- Review the graph to see how your Online conversion rate changed during that period.
- Compare your results with the previous matching period.
- Review Visitors, Orders, Average order value, and Net revenue for additional context.
Tracking these numbers over time can help you better understand your online shop traffic, how often those visits turn into purchases, and which efforts are helping you reach more customers.